48 SIVs granted in September – in line with our expectations of 50 per month (600 per year). UBS/PwC survey of HNW says the largest transfer of intergenerational wealth (especially from Asia) is coming, Hangzhou has more billionaires than Paris or San Francisco, China’s HNW hold 9% of assets in cash, the lowest compared to their global counterparts, plus insights on risk appetite and service needs from the Hurun survey.
SIV data for Sept 2016
14 ‘new regime’ SIVs were issued in Sept 2016, taking the total for the first quarter of this financial year to 37.
34 ‘old regime’ SIVs were issued in Sept, taking the total for the July -Sep quarter to 104.
The 48 total for the month of September is on track with our estimates of 50 per month (old and new regime SIVs issued) which we noted in our previous newsletter appears to be the Department of Immigration and Border Protection (DIBP)’s maximum number they can approve due to limited staff resources in conducting due diligence on the applicants.
There were 118 state government SIV invitations in the Sept quarter. Assuming 85% approval rate = 100 new regime SIVs eventually approved. Annualised equates to 400 per year.
As of 30 Sept 2016, 1575 SIVs have been granted since the scheme commenced on 24 Nov 2012. This equates to ~$7.9b invested in complying investments
See our recent newsletter referring to the Productivity Commissions recommendations to close the SIV scheme.
We are forecasting the scheme will not be closed given it was a Labor government initiative that was carried on by the present Coalition government.
Positive comments by the Federal Treasurer Scott Morrison at a recent Lowy Institute speech in Sydney about the need for immigration and foreign investment suggests he is favourable to the scheme.
Mr Morrison’s comments, when he was Immigration Minister, about the SIV scheme helping attract global investors who will transfer their wealth, families, and business IP and connectivity to Australia,…. also suggests to us that the scheme will be kept.
1 July 2016 to 30 September 2016 SIV data
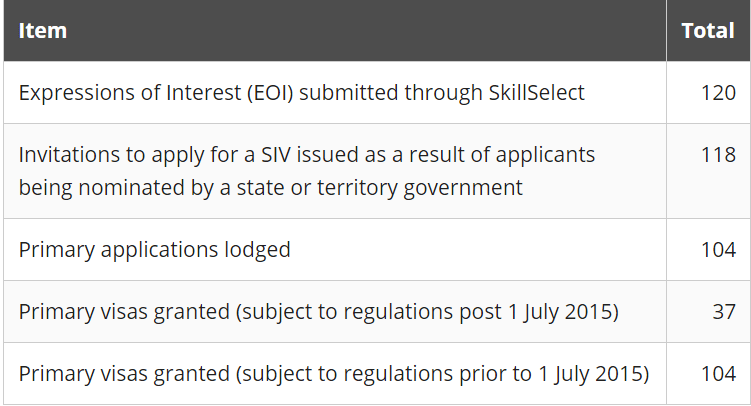
Source DIBP. See below for more tables on the SIV
Another BRW Rich 200 List in the making? Try the Basis Point Aus-China Rich List!
With 1575 mostly Chinese SIV migrant families moving predominantly to Melbourne and Sydney, a new ‘BRW 200 rich list’ could be created!
Most of the SIV are believed to have wealth in the $50m – $100m range (but is much higher for some of the SIV). While this wealth is below the $300m or so cut off for the BRW Rich List, it would be an interesting but near impossible exercise to create an Aus-China rich list. (near impossible due to their desire to remain private and the lack of publicly available information) But we at Basis Point are attempting this. Stay tuned!
Importantly, the SIV are having an impact on prestige properties in these cities. Its a demand/supply issue – 1575 new home buyers in a tightly held prestige market means prices will go higher. And prestige property prices will definitely go higher relative to the rest of the residential property market.
Other HNW News
UBS Group and PwC has released their joint annual billionaires report.
- It notes 113 Asians became billionaires last year, representing 54% of the global total, while 80 of them were from China, with an average age of 53 years old. Almost half came from the technology, retail, and real estate sectors.
- Asia had 520 billionaires in 2015, US had 538 and Europe had 339.
- With around 85% of Asia’s billionaires being first-generation, the report predicts the largest ever transfer of wealth is coming for the millennial generation.
*
Shanghai remained Asia’s most expensive city for luxury spending, according to a report by private bank Julius Baer. The city was ahead of Singapore and Hong Kong in second and third place respectively. The report noted high local taxes on luxury items and a weaker yuan had led to high prices in Shanghai. However, some luxury goods actually saw price falls last year, partly due to retailers slashing prices amid Xi Jinping’s crackdown on lavish spending.
*
Meanwhile, China’s Zhejiang province has produced 72 billionaires, second only to California with 92, according to data from the Hurun Report. (CNN Wire 29 Sept)
Within the province of Zhejiang, 32 billionaires live in the capital city of Hangzhou, where the G20 was recently held, compared to Paris (30) and San Francisco (28).
*
China’s ultra-high-net-worth-individuals (UHNWIs) amassed $175b in new wealth during the year, according to a report from research firm Wealth-X.
China’s approximately 12,000 UHNWIs hold more than USD1.7t in wealth. (Dow Jones Newswire 27 Sept). China’s richest hold less than 9% of their holdings in cash – the lowest of any nation surveyed in the study. Their assets were mostly in privately-owned businesses, stocks and bonds.
800,000* Chinese HNW to buy properties in next 3 years globally.
(this news item is in our property newsletter but is repeated here. Our SIV service provider readers should note points 7,8 and 9 below)
The annual survey “Immigration and the Chinese High-Net-Worth Individuals 2016″ by Hurun Report and Visas Consulting has found the following:
- 60% of HNW respondents intend to invest in overseas property over the next 3 years. With 1.34m Chinese HNW, that equates to 800,000 buyers, according to Rupert Hoogewerf, Hurun’s founder..(*but see (10) below for sample size…our comment is that the respondents were those who have or are considering emigrating… so one would expect a high % intending to invest offshore. And the 800,000 extrapolation assumes all Chinese HNW are considering emigrating)
- Value for money is the primary consideration when buying a house overseas, followed by high rates of return and the immigration status it confers.
- Main reasons for buying? 43% for living in or renting out, followed by asset allocation and children’s education.
- Where to buy? Close proximity to a good school led by 52%, being in ‘downtown’ (23%) and close to Chinese communities (17%).
- 56% said the Chinese currency weakness was a source of concern. (The yuan has fallen from a high of just over 6 Yuan to the US$ in early 2014 to around 6.77 currently, the weakest since Q3 2010)
- Concerns about a possible property bubble bust in China’s first-tier cities have made China’s HNW consider overseas investment more seriously. And the sharp rise in Chinese property prices makes overseas investments represent more value for money.
- Demand for related services is also on the rise, with investment advice (53%) the most sought-after service, followed by the provision of information about overseas property markets (43%) and overseas property brokerage (32%).
- Overseas financial investment accounted for 15% of the wealth of the individuals surveyed. The main reasons for investing overseas are to spread their investment risk, children’s education and with emigration in the back of their minds.
- When investing overseas, asset safety is the top priority. 64% chose ‘risk control’ as their foremost consideration. Foreign exchange deposits are the investment of choice, at 31%, followed by funds with 15% and insurance accounting for more than 10%. ‘For Chinese HNWIs today, their investments overseas are conservative nest eggs, not risk capital,’ said Rupert Hoogewerf, Hurun’s founder.
- The survey was based on interviews with ~ 300 HNW people with average net assets of CNY27m (A$5.2m) who have emigrated or are considering it.
- HNW is defined as those having net wealth of CNY10m (approx. US$1.5m).
Preferred Countries for Chinese HNW emigration**
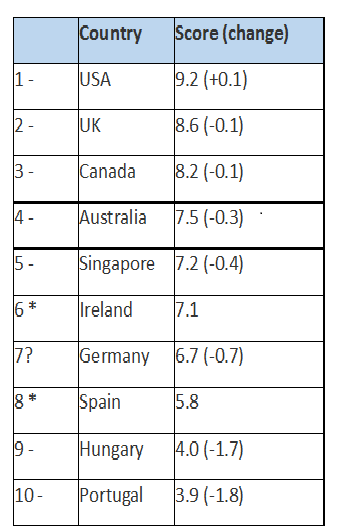
Source: Immigration & the Chinese HNWI 2016, by Visas Consulting Group and Hurun Report. *new to top 10
The scores take into consideration a basket of eight factors, including education, ease of investment, immigration policy, property investment rules, taxation, medical care, visas and ease of adaptation for Chinese emigrants. Australia fell by 0.3 in relative ‘suitability’.
Preferred Destinations for Emigration and Overseas Property Purchases
(Basis Point comment. Where is Brisbane in the rankings, especially if Canberra is ranked 25th?)
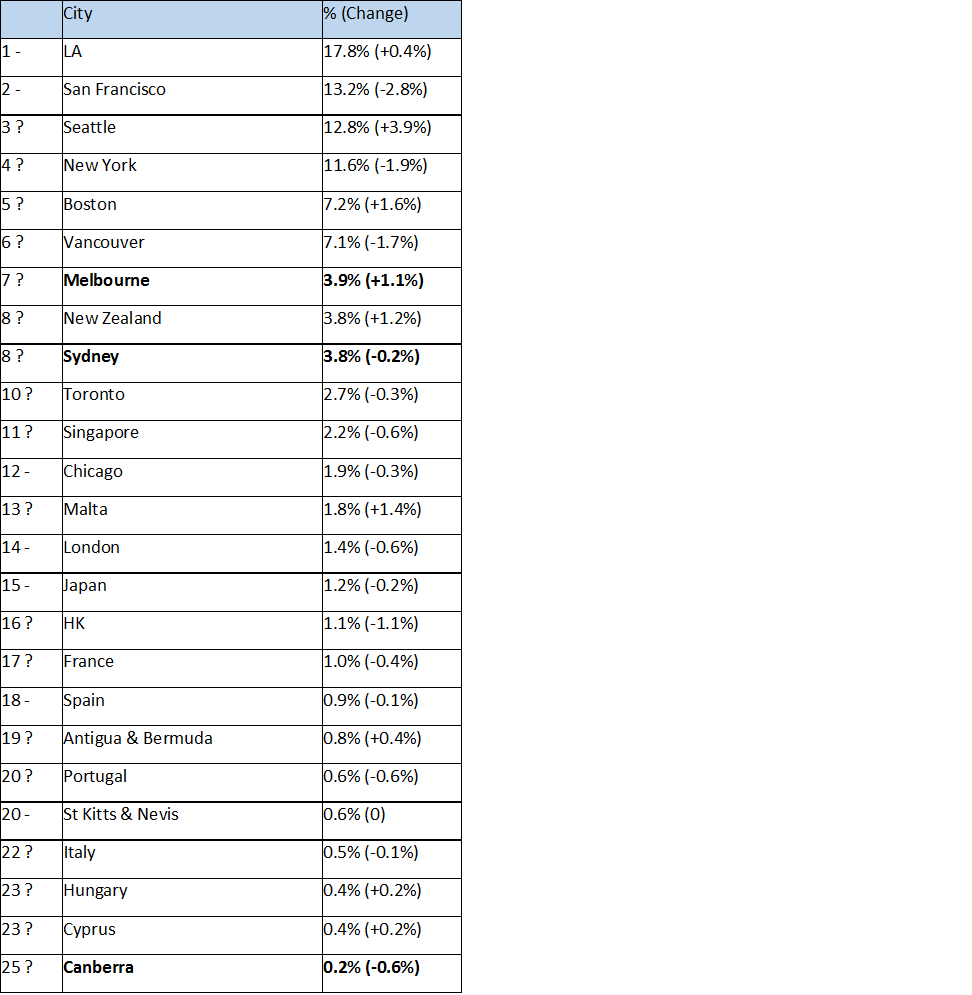
Source: Immigration & the Chinese HNWI 2016, by Visas Consulting Group and Hurun Report – same as last year ↑up ↓down *new to top 10
*
Significant Investor visa: State and territory distribution – 24 November 2012 to 31 August 2016

Source DIBP and Basis Point
The table below shows the distribution of primary visa applications and visa grants for the top five source countries from the commencement of the program – 24 November 2012- 31 August 2016 for the SIV.

Source DIBP
Read more about the Aus-China property development industry at https://basispoint.com.au/news/